At OrthoFi, we are encouraged by the positive response we’ve received from the information presented in the previously shared data update articles. During uncertain times, it is wise to be grounded in facts, so we urge doctors to be as data-driven as possible. We have data on over $2.2 Billion of production we’ve processed in over 385 orthodontic practices (500+ locations), and outcomes on over $500 Million in active patient and insurance A/R. As part of our pledge, OrthoFi will continue to share weekly data on the key metrics that matter.
The data in the charts presented below is aggregated by week, with the date being the start of the week. The latest data set is the week of April 5th to April 11th. Our next update will include data from April 12th to the 18th, and so on.
Practice Closures and Exam Dates
During this pandemic crisis, it seems like the outlook of our world changes with every passing day, with never-ending news coverage and constantly changing guidelines. As part of our commitment to delivering industry-best Revenue Cycle Management (RCM) services, we need to properly forecast case volumes to be able to manage our staffing. In order to better project the impact of closures and plan for the return of open offices, we have been surveying our 385+ practices weekly and asking them when they predict they will reopen. Here is the collective response to those surveys:
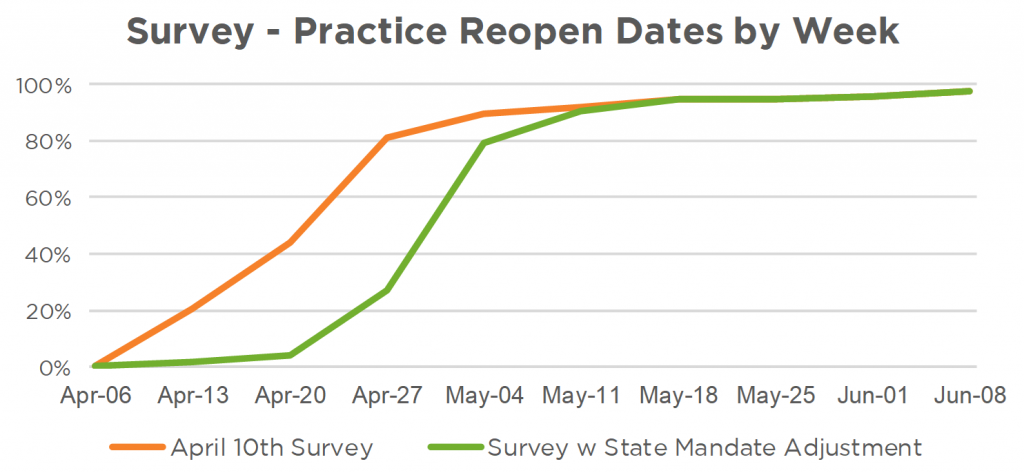
For practices in states with stay-at-home orders, we have overridden any responses with dates prior to the state-mandated guidelines. As shown, there is a steep increase in offices anticipating to reopen the week of May 4th, which parallels the guidelines in most states, with some East and West coast states moving to adopt more conservative measures.
Another indicator of a return to normal operations is our exam trend data. As part of our Patient Acquisition CRM software flow, we collect exam dates/times which we use to queue up insurance benefit calculation results. Not only do we monitor the actual exam times, but we record the date exams were made. Take a look at the chart below:
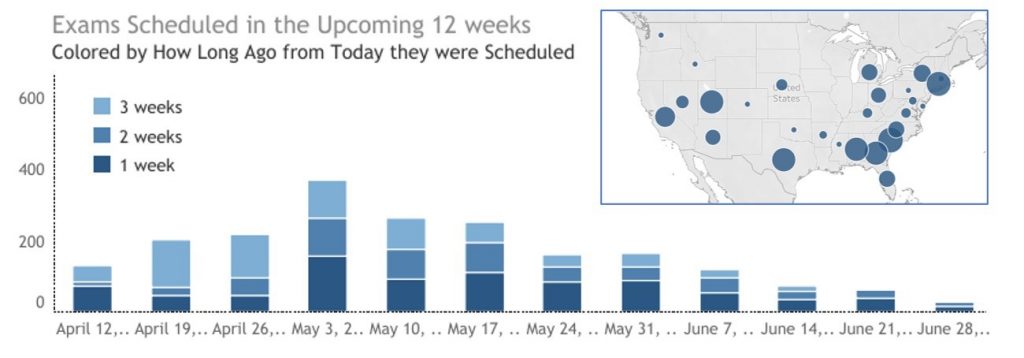
The exams are separated by week, but within that, by how many weeks ago those exams were scheduled. Typically, OrthoFi sees 7,000-8,000 exams per week, so you can see the significant drop-off in exam activity overall. However, what is interesting here are the exams displayed in dark blue, showing exams set within the last week. You can also see these by volume (bubble size) by state in the inset map.
This provides a glimpse into the most recent trend in scheduling activity across the country. As indicated by the survey, there is a notable increase in exams created for the week of May 3rd, but the total volume of exams does not match up with the responses in the survey above. If 80% of practices were to open, we would expect to see over 5,000 exams scheduled for that week. We assume this discrepancy relates to practices taking a cautious approach to scheduling in response to how often reopen dates have pushed out over the last 4 weeks or so. Until practices are certain that they will be able to open, they may be hesitant to set their schedules.

Another interesting data point is that although 98% of our practices are shut down in April, there is a growing number of exams being set this month, with a fair number this week. This is likely due to the rise in virtual consults. The recent survey results from our 385+ practices, showing that a significant percentage (38%) have now adopted virtual consults to maintain continuity with prospects and patients. With a fully digital workstream, innovative practices are finding they can not only consult with patients remotely, they can convert a fair number of them, and even get signed contracts. For more information on how to incorporate virtual consults into your processes, watch our latest webinar.
Patient A/R
With the global pandemic’s impact to the economy, practice owners are concerned about their aging A/R and collections during the shutdown. As reported in our update last week, our autopay payment success rate has not changed since the onset of this crisis. We are seeing the same percentage of credit cards and ACH withdrawals go through successfully. However, we are seeing an overall increase in our A/R aging >30 days. As mentioned briefly in our last update, this increase is certainly affected by the economic pressures on patients and their payment performance, but there is also another factor which is simply a derivative of having no new starts. Take a look at this analysis:
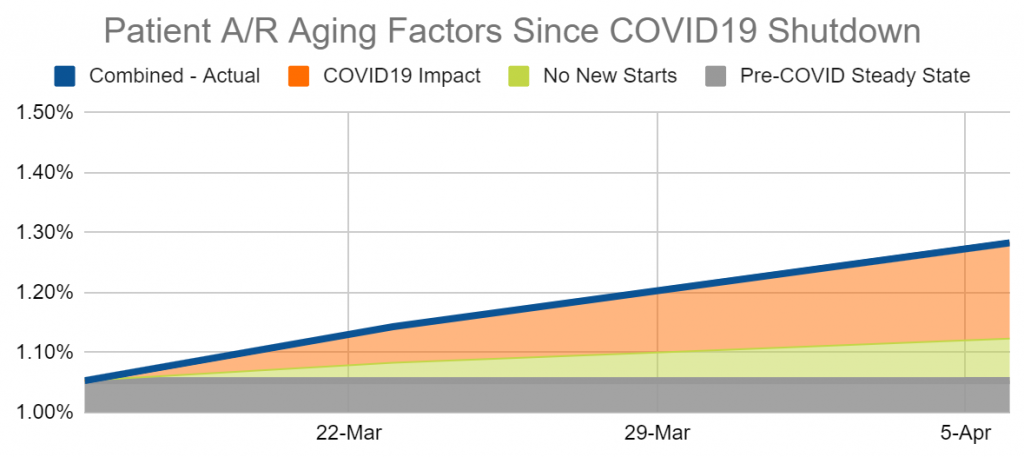
Pre-COVID Steady State: patient A/R aging (>30 days) is at 1.05%, a level we had maintained consistently prior to the March 16th shutdown. That is the baseline control for our comparison.
Pre-COVID Steady State: patient A/R aging (>30 days) is at 1.05%, a level we had maintained consistently prior to the March 16th shutdown. That is the baseline control for our comparison. No New Starts: Although it is still at an exceptionally low level, our overall aging has increased by 23% over the last 3 weeks. One third of the increase in patient receivables comes from having no new starts. You might be asking, “how does that work?”. Your A/R performance is a ratio of your delinquent A/R divided by your total A/R. Normally, your aging A/R benefits from a constant infusion of new A/R, which has no delinquency. If you eliminate new starts and the associated receivables, the total A/R dollars (the denominator of the aging ratio) will start decreasing from payment plans completing and dropping off the total.. As receivables age, the numerator of aged A/R will eventually decrease to some extent, but not as quickly. Patients who would have paid will eventually pay their balances, assuming you continue but with the normal diligent follow-up effort. Those who were not going to pay before will continue to slide. So over time, with no new starts, your patient A/R aging will increase even without a change in patient behavior.
COVID-19 Impact: Looking deeper, roughly two thirds of the increase in receivables is due to a deterioration in average patient performance. This can be isolated by evaluating 30+ day aging buckets against the expected total A/R dollar that we would expect under normal circumstances. Due to the financial hardships and market volatility during this unprecedented time, the average A/R dollar is incrementally more likely to become past due, and to age further if already past due.
Combined – Actual: The two factors described above are stacking up to increase A/R aging – lack of starts and increasing delinquency due to financial hardships presented by this crisis. Knowing the contributing factors should help you understand what is driving your A/R numbers. It also allows you to forecast how delinquency performance will shift once you reopen and start adding new production. The green section should progressively disappear, leaving you with the remnant patient behavior as a results of the financial impacts to the economy.
So, considering the data, are there any areas to focus on to minimize delinquency? Aside from maintaining tight disciplined protocols on your collection activity, one of the clearest factors is autopay. The chart below is an update of last week’s article, showing the overall week-over-week patient A/R performance filtered by accounts with autopay vs. those with no autopay payment method on file.
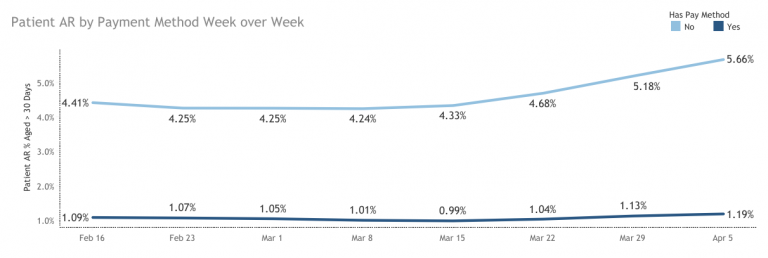
We continue to see an increasingly widening separation of A/R performance between accounts with and without autopay. Although those with autopay do show an expected rise in past due aging pre and post-COVID (roughly 10%), the accounts without autopay on file reveal a very different picture. Since February 16th, non-autopay accounts have seen a 28.3% increase in delinquency, and almost 10% higher in just the last week. Thankfully, this population only accounts for a small portion (9%) of OrthoFi’s overall accounts receivable, so our overall aging trend is flatter. In your practice, if you have not implemented autopay or have not been diligent about requiring it when patients sign their contracts, your patient A/R might be at greater risk. Read our last article for more insights and guidance on that.
Insurance A/R
The same factor isolation analysis is relevant for insurance A/R, but the COVID19 factor is not as prevalent. Take a look:
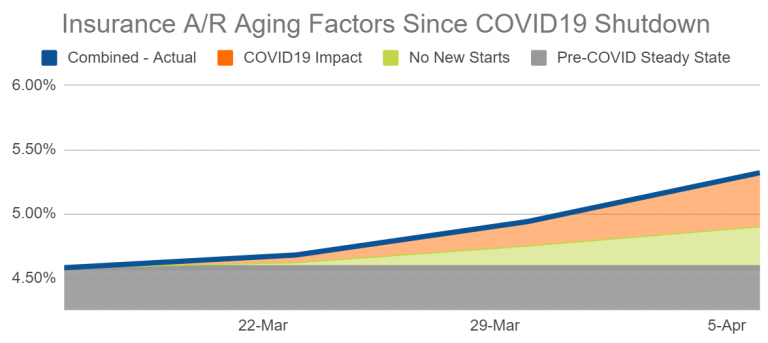
No New Starts: As with patient A/R, having no new starts causes a decrease in total A/R balance. The aged claims will be resolved, but over time. This causes a natural lift in the aging metric.
COVID-19 Impact: For payment performance, insurance companies are not necessarily as affected by the impact to the economy as patients are. So the relative impact of these factors is closer to 1 to 1. However, what we have seen working with over 700 carriers is that most of them have scaled back their staffing. This has shown a measurable impact on time-to-pay as well as responsiveness to claim status questions and appeals. What this means is that if you manage this internally, it will take more focus and effort to ensure steady collections in this area. If you let things go during this period, given that it will take your team some time to get back into full gear when you open, you may risk some claims going beyond timely filing.
***Benefit Termination Alert: OrthoFi is also closely monitoring and projecting the impact of unemployment on insurance receivables. Due to those families who lost their benefits due to a layoff (vs. retaining them with a time-based furlough), we will see a spike in termination of coverage. For all those terminated plans, insurance balances will need to be transferred to the patient responsibility, at least in the short term until there is new valid coverage. When this happens, practices managing their A/R in-house will need to coordinate this shift. This may be more challenging for accounts already in a delinquent status, so we are working diligently to keep accounts in good standing through this time to prepare. We project that it is still a bit early to assess the full impact of this scenario, but as we start to see actionable data and outcomes, we will add this to our updates going forward.
Takeaways – What the Data Tells Us
- Despite unprecedented shutdowns and unemployment filings across all businesses, A/R delinquency has not increased exponentially in our data.
- Practices around the country are tentatively planning to reopen in early May, but the uncertainty of stay-at-home guidelines are causing a hesitation to schedule exams.
- The number of practices offering virtual consults is rising quickly with some early success.
- Patient A/R aging is increasing due to not having starts and due to macroeconomic effects on patient payment performance.
- Monitoring your patient A/R regularly and being prompt with your delinquent follow-ups is more important than ever – especially with those accounts who do not have autopay.
- Insurance is paying slower and requiring more follow-up to deliver consistent collections. Make sure you have someone consistently monitoring your insurance A/R and keeping things on track.
- Unemployment Foreshadowing: as layoffs lead to coverage termination, more pressure will shift to patient collections. Financial coordinators need to stay diligent to keep accounts in good standing to avoid a stack-up of unplanned insurance balances with past due patient responsibility.
We hope this data can be a valuable resource during this time. We will continue to update these metrics, and add new areas of focus as new meaningful trends emerge.
If you want to automatically receive these updates, please follow us on Facebook. If you have any questions you’d like us to answer, please post your question on our page, or visit us at StartMoreSmiles.com to connect with one of our practice experts.