We know that during this precarious time, many practice owners are anxious and hungry for information and guidance. It’s difficult to know who to go to, since no practice owner has been through a complete shutdown of this national scale before. Understandably, there are a lot of opinions swirling, so we urge doctors to be as fact-based and data-driven as possible. We have data on over $2 Billion of production we’ve processed in over 360 orthodontic practices (500+ locations), and outcomes on over $500 Million in active patient and insurance AR. During this shutdown, OrthoFi will pledge to share weekly data on a number of key metrics that matter.
All the data in the charts shown in this update is aggregated by week, with the date being the start of the week. So the latest data set is the week of March 29th to April 4th. Our next update will include data from April 5th to the 12th, and so on.
Patient Starts
Practice closures around the country have dealt a significant blow to practice production. One of the basic data points we will continue to update is the trend of starts per practice. In future reports, we plan to share complementary survey data from over 360 practices around projected open dates and use of virtual consult technology.
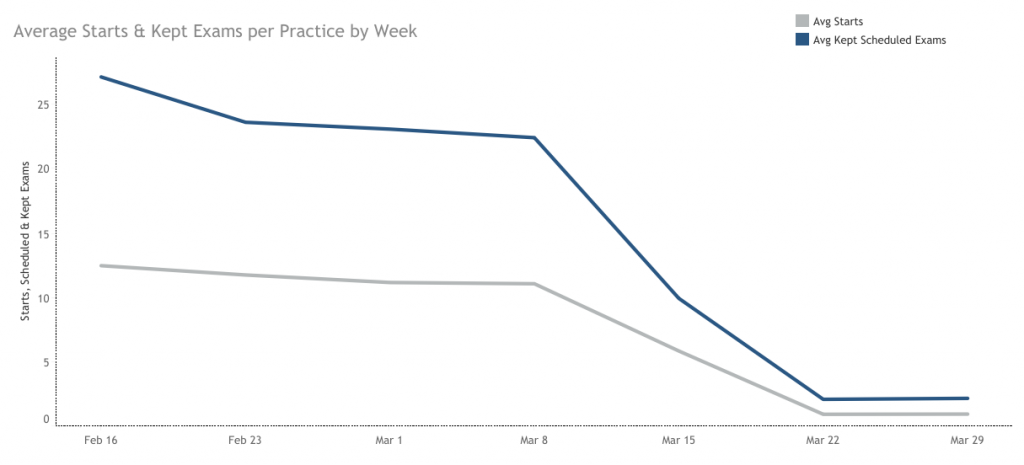
As you can see, the week of March 15th reveals the cliff drop-off in starts, which continues to date. We have seen a dramatic pivot by many doctors to explore virtual consults, both to close current pending patients (pre-COVID19 closure exams) and to convert patients who were scheduled. Although we’ve heard scattered reports of success using this technology from a few of our key advisor practices, it has yet to lift our overall averages. For more information on how to incorporate virtual consults into a fully digital workstream, check out this recent free webinar.
Patient AR
With the global pandemic’s impact to the economy, many practice owners are concerned about their collections during the shutdown. You can read our last article projecting collections through 9 months of shutdowns. Related to this are the questions about payment performance and delinquency. Here are a few important dashboard metrics we are monitoring to assess the health of our accounts:
As the chart shows, our autopay success rate (Credit Card and ACH combined) has not decreased. It has remained stable throughout the onset of COVID19 and the nationwide shutdown. Our hypothesis is that to date, stay-at-home guidelines have caused a dramatic reduction in family discretionary spending (e.g. eating out, travel, luxury purchases, etc.). Although being at home has incrementally increased utility usage and grocery costs, this is relatively small compared to the above spend categories. As this data reflects performance of the week of March 29th, it does not yet reveal the impact of the mass furloughs and unprecedented unemployment increase of the last 7 days, and the April rents/mortgages were not due yet. Although federal stimulus and unemployment relief programs will hopefully soften the fall for families, we will likely see erosion in payment success, likely starting with ACH withdrawals.
Here is another data point that validates that there has been little short-term impact on payment plan collections. OrthoFi is actively managing over 200,000 patient accounts, and we document all payment plan adjustments by reason codes. We are measuring the total percentage of active plans which have been adjusted due to the Financially Responsible Party (FRP) claiming financial hardship, including any hardship related to natural disaster or, in this case, COVID19.
Our data shows the mix of hardship-related adjustments has actually dropped a bit since the practice shutdowns began. Again, this likely points to short-term household expense reductions. It will likely take 2-3 weeks for severance pay to run thin and families to start making deeper cuts to their less essential expenses as April rents/mortgages come due.
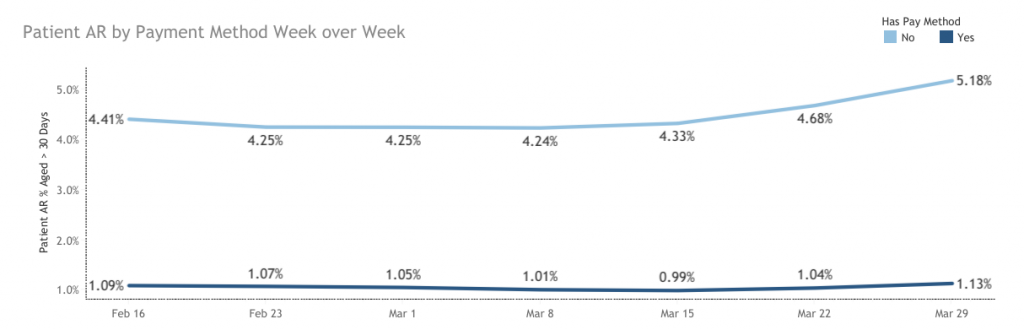
So you might think we’re saying, “so far, so good,” but here’s where it gets more interesting. Take a look at this:
Overall, our patient AR aging >30 days as of last week was 1.13%, which represents roughly a 4% increase since pre-COVID closure periods (February 16th). However, here’s where it gets interesting. This chart above shows that there is a big difference in performance between the accounts with and without autopay payment methods on file. Although those with autopay do show an expected rise in past due aging pre and post-COVID (roughly 4%), the accounts without autopay on file reveal a very different picture. Not only are they more likely to be delinquent in a normal state (4 times more on average), but during this period they have seen much higher rise in delinquency. Since February 16th, these accounts have seen a 17.5% increase in delinquency. Thankfully, this population only accounts for a small portion (9%) of OrthoFi’s overall accounts receivable, so our overall trend is flatter.
What this raises for practices at large is that if you have not implemented autopay or have not been diligent about requiring it when patients sign their contracts, your patient AR might be at greater risk. FRP’s that need to remember or take action to make a payment are likely failing to do so, either because they are actively holding back payments or because they are focusing on more critical expenses. It is also likely that the population who declined autopay live more paycheck to paycheck.
The key, especially for this group, is to be prompt. If they are not paying you, they are likely not paying other vendors. If you contact them for payment first, even if you have to bend on terms or timing, you are more likely to get their commitment to pay something. We expect this trend to persist and escalate. Some of the increase in aging will increasingly be due to the stagnation of the AR pool. What that means is that with no new patient AR from new starts (always current), the remaining AR will by definition age more as time goes on. Stay tuned for more on this in future update articles.
Insurance AR
Most practices take insurance receivables for granted. We all know insurance companies are tedious to deal with, but most plans will pay eventually with consistent follow-up. Largely that is true. However, most insurance plans front load their reimbursements, so there is an initial drop in insurance payments with a prolonged practice closure. For more on that, read our last article.
Since most initial claim payments come in with 21-45 days and are typically between 25-33% of the total claim value, we are still not seeing the full impact of practice closures from Mid-March. In addition to that expected drop, we are seeing service level changes with insurance carriers across the country. Of the over 700 carriers we work with regularly, over 30 smaller regional carriers have shut down or significantly shuttered operations. Others have stopped receiving paper claims. Larger carriers are open, but we have confirmed that they have significantly scaled back staffing. This is causing a slowdown in claim processing, payment remittance, and claim status follow-up resolution.
What this means is that if you manage this internally, it will take more focus and effort to ensure steady collections in this area. If you let things go during this period, given that it will take your team some time to get back into full gear when you open, you may risk some claims going beyond timely filing. As we start to see actionable data and outcomes, we will add this to our updates going forward.
Takeaways – What the Data Tells Us
- Practices around the country are closed, but some innovators are leveraging technology to schedule virtual exams and sign contracts.
- Make sure to monitor your patient AR more regularly, and be prompt with your delinquent follow-ups especially with those accounts who do not have autopay or payment method on file.
- Due to staffing changes, insurance is paying slower and requiring more follow-up to deliver consistent collections. Make sure you have someone monitoring your insurance AR and keeping things on track.
We hope this data can be a valuable resource during this time. We will continue to update these metrics, and add new areas of focus as new meaningful trends emerge.
If you want to automatically receive these updates, please follow us on Facebook. If you have any questions you’d like us to answer, please post your question on our page, or visit us at StartMoreSmiles.com to connect with one of our practice experts.