Well, however we got here, summer is upon us! Judging by the starts surging into our system, we seem to be experiencing a sharp bounce back. It is still very early to call it, and the threat of a second wave of regional or local closures is still out there, but we are happy to report that the leading indicators are pointing to a faster recovery than we originally projected. This week, we wanted to shift gears from cash flow and disaster planning to highlighting trends that help you to understand how to position yourself for an optimal ramp-up.
As practices reopen and starts flood back into our system, OrthoFi continues to forecast and model what that recovery will look like. As detailed in our previous article, the open question is how the COVID impact to the economy will shape consumer demand for orthodontic treatment. Within this question, there are two scenarios to explore: 1) is the sharper recovery we’re seeing due to pent-up demand from the lost weeks of the closure?; and 2) will there be a lingering impact that limits the recovery? The data in the charts presented below comes from over 385 OrthoFi practices (500+ locations), over 450,000 patients started and over $2.2 Billion of production processed
[Don’t] Call It a Comeback…?
We’ve certainly seen the volume of exams return to and exceed pre-COVID levels, which would point to a full summer recovery. However, we’ve spoken with a number of practices who have reported that their spike in starts is mainly due to the rescheduling of new and recall patients who had been delayed, and that they had not seen the expected volume of brand new patients calling in to make appointments. In response to this feedback, we went back to the lab and took a closer look. This chart helps to make sense of this.
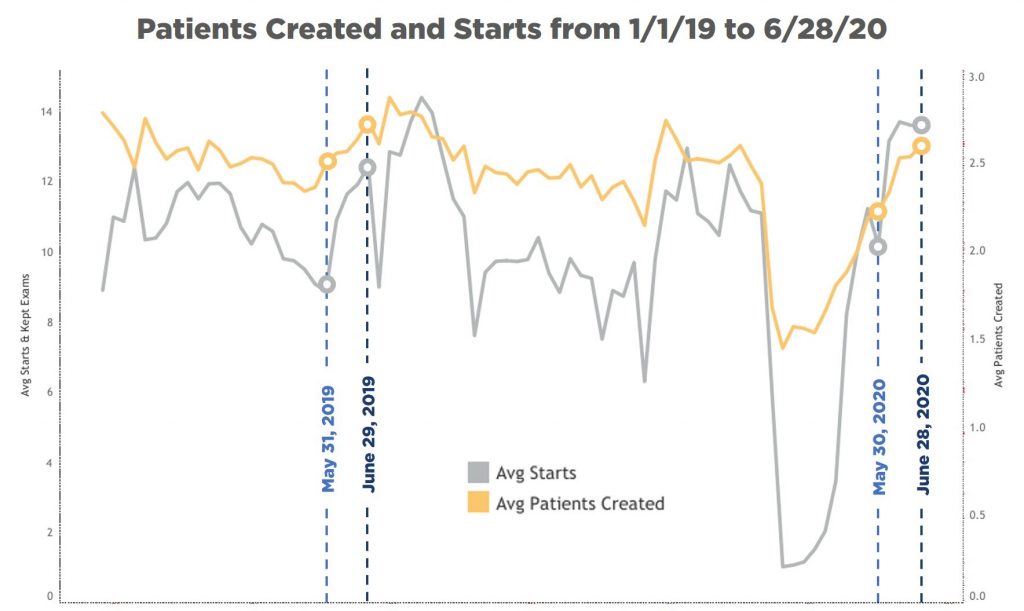
The chart shows, by week from January 1st 2019 to June 28th 2020, the volume of both ‘average starts per practice’ (measured on the left Y-axis) and ‘average new patient records created per practice’ (measured on the right Y-axis). ‘New patient records created’ is a good representation of organic demand, as it tallies only exams created from brand new patients, thereby excluding rescheduled exams. It is also a fairly solid leading indicator of future starts assuming treatment-recommended and conversion rates stay constant. We are highlighting the last full weeks of May and June from 2019 and 2020 to help with the year-over year comparison.
As you can see, the 2020 starts for both May and June compare positively to 2019, up 11% and 17% respectively. However, new patients created in 2020 were down 10.5% YOY in May, and down 5% YOY in June. The mini-plateau of starts in the last couple of weeks could be the result of a lag of new patient demand. This lag echoes the feedback we received from our practices, and likely stems from several main factors:
- Many practices turned down/off their marketing activities during the COVID shutdown;
- Some practices were not taking new appointments during the shutdown, electing to focus exclusively on previously scheduled patients;
- Dentistry in general was not seeing active patients, therefore there was no opportunity to refer new patients;
- Lack of community/social activities left little to no opportunity for person-to-person referrals.
The good news is that the new patients created trendline is surging upward to approach prior year levels, and is likely to return in the next week or two. This is a good sign. We will be keeping our eyes on it and report out if we see this trend change.
Long-Term: Age Before Beauty?
In analyzing the potential longer-term impacts to the recovery, we sourced the 2008 recession as a potential analog for an initial hypothesis. In 2008, following the crash of the stock market culminating in the bankruptcy of several pillar brokerage firms, banks and major automakers, the orthodontic market took an expected hit. Overall, starts were down year-over-year in the US about 8%. The interesting factor is that this decrease was mainly concentrated in adult starts. At the time, adult orthodontic cases represented around 20% of case volumes, 5 points lower than today’s latest reported mix. The best data available shows that adult ortho suffered a 30% drop, which accounted for the lion share of the overall dip in case numbers. The remaining 2 points came from a ~2.5% impact to child cases, which most practice owners would characterize as more of a delay in treatment by families than a rejection of treatment for their child. So in modeling the economic impact on consumer demand coming out of the COVID shutdown, we hypothesized that we would see a similar pattern: child cases would come back faster and be a higher percentage of the overall mix of cases. However, that hypothesis does not seem to be bearing out. Check out the following chart:
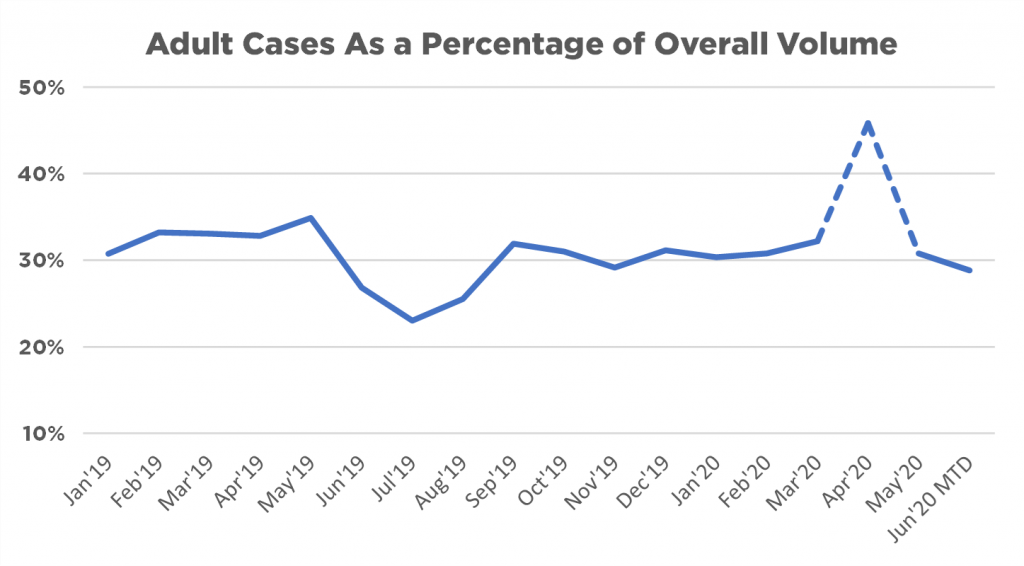
This chart shows the percentage adult case starts represent out of the total case volume in our system from January 2019 to the month-to-date results in June. We wanted to examine a full annual cycle to make sure we accounted for typical seasonality. First of all, you can see that, with the exception of the summer months, OrthoFi’s average is just above 30%, a bit higher than the national average. We attribute this to our focus on ‘intelligent flexibility’ and higher average same-day-starts. Our earliest published data points to the fact that adult conversion rate is much more dependent on converting same-day, with likelihood to convert dropping further and faster after the patient leaves the office. The second observation is that in the summer, while adult ortho case volume stays fairly steady, the sharp rise in child case volume while kids are out of school pushes down the adult mix over those months as much as 7-10 points. The slight uptick in May is an indication of the annual dip in starts as kids focus on finishing the school year.
So now let’s look at 2020, and see how the pandemic shutdowns have affected the mix of cases. As you can see, there has been very little noticeable change. April is shown in dotted lines to denote that this data point is very likely skewed due to a low sample size (less than 10% of the total expected volume of cases). Both adult ortho cases and child cases dropped precipitously, but adult cases didn’t drop quite as much, so the percentage climbed. On the whole, the fact that adult cases are maintaining is another positive sign, as this is historically the first segment of cases to drop off due to economic impacts. Again, it is still likely too early to brush off the impact of unemployment and the impact of closures on small businesses, but so far so good.
Takeaways – What the Data Tells Us
- May and early June starts surged, partly from the pent-up demand from lost start opportunities as a result of the practice shutdowns. However, new patients created volumes are increasingly sharply, a good leading indicator of an organic recovery ahead.
- If your practice has not yet resumed your most effective marketing activities, you should consider turning them back on. If not, you may experience a lull of starts after the surge from delayed exams winds down.
- Unlike patient demographic trends from the 2008 recession, the macroeconomic impact of unemployment and government stimulus has not changed the mix of adult to child starts post-COVID, another positive indicator that the V-shaped recovery is possible.
- As stated in our Week 4 Article, do not assume that patients are financially compromised, but be prepared with open choice flexible terms if they are.
If the trends continue to show no change from pre-COVID benchmarks, that could very well be a positive indicator that there may be far less long-term impact than previously feared. Reasons for this point to the paradox we’re seeing play out with the sharp recovery of the stock market coinciding with record unemployment and economists talking about a recession. Arguably, what is unique about this economic situation is that unlike in 2008 where the financial impact and unemployment was felt by both white and blue collar families, COVID seems to have disproportionately impacted lower income hourly employees connected to production. This population, by the numbers, is less of a direct overlay of the bell curve of orthodontic patients. A quick and preemptive federal relief and stimulus package also helped create a soft landing for families.
Another potential explanation is that while stay-at-home guidelines restricted some family income, we also saw unprecedented reductions in expenses. With little to no travel, restaurant meals and entertainment, families were able to store up some savings. In fact, OrthoFi practices have seen an uptick in pay-in-full percentages and overall same-day cash (pay-in-fulls plus down payments as a percentage of overall production). As detailed in our Week 4 article, we have seen little to no impact to affordability, and very little increase to courtesy discounts to drive starts.
We hope this data can be a valuable resource during this time. We will continue to update these metrics and add new areas of focus as meaningful trends emerge.
If you want to automatically receive these updates, please follow us on Facebook. If you have any questions you would like us to answer, please post your question on our page, or visit our website at StartMoreSmiles.com to connect with one of our practice experts.