Almost two months ago our industry, along with the rest of the world, braced for uncertain and unprecedented times. COVID19 will undoubtedly make an indelible mark in history and we’re still shuffling to find our ‘new normal’. We’re happy to report that we have strong proof of life. In the last two weeks, many of our practices have made strides to reopen and resume seeing patients. Although a full recovery is still some way off, we are very encouraged by the performance we’ve seen.
Six weeks ago we started publishing a series of articles, to help orthodontists stay connected to data and to help nurture a better understanding of the trends. Our first article set out to project collections as practices shut down and starts came to a screeching halt. So it is only fitting, that as practices make plans to recover, we try to project what that climb could look like. This future is more challenging to predict, as it not only involves calculating annuity income streams but also predicting consumer behavior changes stemming from lingering financial and safety concerns.
Most economists, including the Chairman of the Federal Reserve Jerome Powell, seem to agree that the US economy will rebound. The pre-COVID market performance was fundamentally strong and seemingly sustainable. Unemployment was near all-time lows and consumer spending was solid. Experts have made a point to differentiate the externally driven catastrophe that is COVID from the underlying red flags that drove the crash and recession in 2008. Chairman Powell recently stated that if federal stimulus continues to flow to avert long-term unemployment and the collapse of small businesses around the country, we can withstand this pandemic.
However, speculation about the timing and shape of that recovery is far more variable and contested. Some predict a fairly sharp ‘V-shaped’ curve with businesses and consumer spending resuming as soon as restrictions are lifted. Others are projecting a slower ‘swoosh-shaped’ recovery, citing that record unemployment and consumer confidence will need time to get back to normal. As a business owner, you need to plan for each scenario differently. Reopening is not just a light switch. You should think about how you stage your team’s return and how you stage restoring your operating costs. Here are two recovery scenarios OrthoFi is modeling and forecasting from:
Our projections are based on averages from 385 practices and data from over $2 Billion in production and 450,000+ patient starts.
- Avg Starts/Year: 391
- Avg Production/Start: $4,644 (incl. Limited Tx and Phase I/II), $5,193 for comprehensive Tx
- Avg Patient Responsibility: $3,695
- Avg Insurance Benefit: $949
- Avg Patient Plan Length: 21 Months
- Avg Insurance Timeline: 12 Months
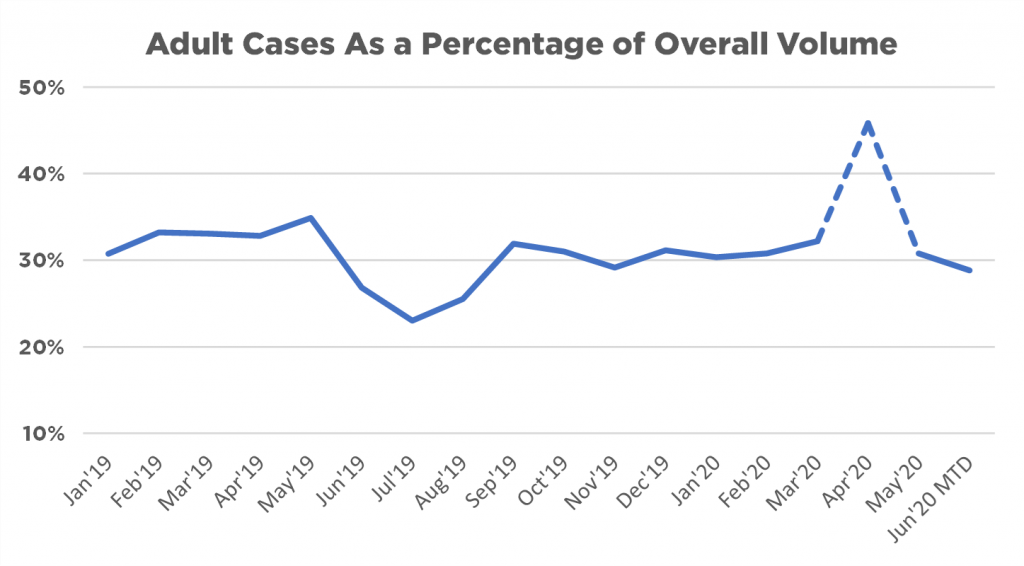
The grey dotted line above is our original starts forecast per practice going into 2020. You can see the standard seasonality of patient inflow and that performance was exceeding forecast in the first quarter prior to the outbreak. Starting the week of March 16th, practice closures around the country cratered starts to near-zero levels. A maverick group of innovative early adopters rallied to find alternative ways to attract and convert patients leveraging our digital patient workflow and virtual consult technology, but the aggregate impact was severe.
The orange and dark blue curves depict two sets of possible futures. The dark blue curve represents the ‘swoosh-shaped’ pattern, with a bit of a rebound for pent-up demand, and then a progressive climb as more states reopen and consumers slowly regain confidence and the perceived financial stability to seek treatment. As you can see, the swoosh curve comes short of a full recovery within the year, following the guidance that the economy will face some bumps throughout the year, and perhaps into 2021. The orange curve is more of the V-shaped pattern. Although starts per practice don’t return to pre-COVID projections until the end of summer, it does show a full recovery in the fall and holiday season.
The orange and dark blue curves depict two sets of possible futures. The dark blue curve represents the ‘swoosh-shaped’ pattern, with a bit of a rebound for pent-up demand, and then a progressive climb as more states reopen and consumers slowly regain confidence and the perceived financial stability to seek treatment. As you can see, the swoosh curve comes short of a full recovery within the year, following the guidance that the economy will face some bumps throughout the year, and perhaps into 2021. The orange curve is more of the V-shaped pattern. Although starts per practice don’t return to pre-COVID projections until the end of summer, it does show a full recovery in the fall and holiday season.
So which curve is it going to be?
Early May results are very encouraging and seem to be tracking to the V-shaped curve, but it is far too early to predict at this point. The reality could very likely land between these two curves, or the V-shaped recovery could come short of full recovery in the fall, or the Swoosh recovery could see a late-year surge above the forecast line indicating a delayed overcompensation. However starts end up coming in, it’s important to translate this into collection dollars, as that is what your practice ultimately takes home.
Let’s break down practice collections. Here are four sources of collections OrthoFi manages daily:
- Same-Day Cash (28% of monthly collections): The total amount of Pay-In-Fulls (PIFs) plus the initial Down Payments (DPs) received from patients when they start treatment.
- Initial Insurance Payments (9% of monthly collections): Typically 25% to 33% of the total benefit pays within 30 to 45 days after the claim is submitted.
- Insurance Payments (11% of monthly collections): Continuation payments from insurance companies, varying in cadence by carrier (i.e. monthly, quarterly, semi-annual or annual).
- Patient Monthly Payments (52% of monthly collections): Scheduled monthly payments.
Projecting out these assumptions over the rest of 2020, we present two charts below of what your collections could look like in each scenario (Swoosh or V-shaped recovery). To help you understand what is driving the comeback, we’ve shown the breakdown of your collections as detailed above. We’ve also taken a few temperature readings in April, August and December, comparing our projection year-over-year with actual collections per practice in 2019. This should help you understand what you can expect to come in, so that you can make adjustments to your costs as needed to preserve your net income.
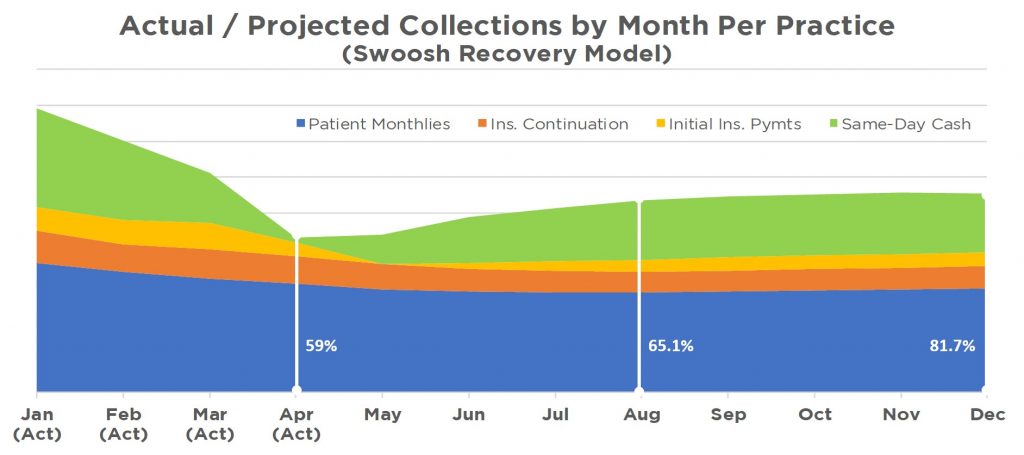
The Swoosh recovery model shows the phased introduction of same-day cash in May as practices start reopening. This balances the lagging effect of diminishing initial insurance payments from no starts in the prior 6-8 weeks. The downward trend of patient and insurance payments flattens out. Same-day-cash does fuel growing collections, but at the risk of mentioning an overly used COVID term, the Swoosh recovery ‘flattens the curve’. August comes in at 65.1% of pre-COVID levels and then very gradually increases to over 80% by December. Overall, this model yields annual collections 24.8% below prior year, which amounts to $443,071 for an average practice.
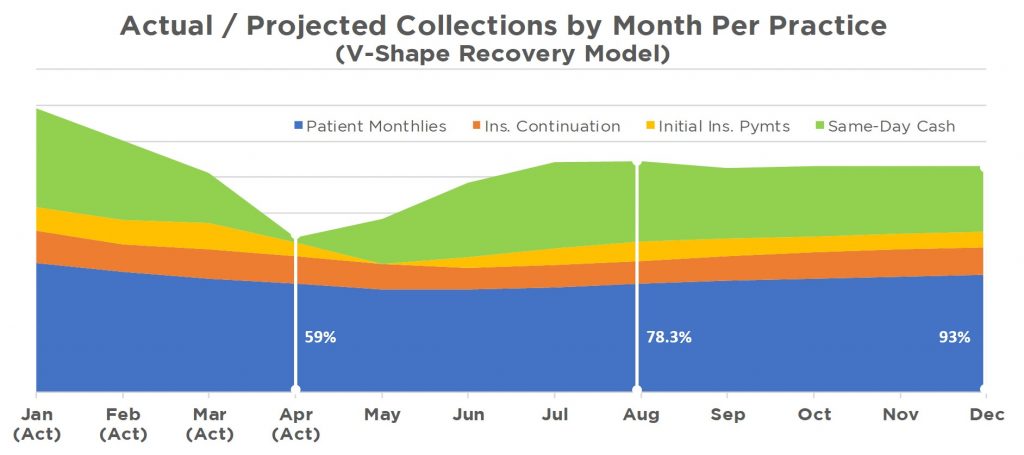
By comparison, the ‘V-shaped’ recovery model more closely echoes the summer seasonality swell of a typical year, albeit at a lower peak revenue level. May’s infusion of same-day-cash from starts jumps a bit higher than the Swoosh model, and you can see that even though insurance initial payments come to a stop, there is month-over-month growth. You see the impact of a summer rush, with August registering at nearly 80% of pre-COVID levels, and then slightly tapering off as kids go back to school and we enter into a normal holiday season. The year-end collections get very close to prior year levels at 93%. Monthly insurance and patient collections initially bottom and then resume a slow gradual climb. Overall, the V-shaped model yields annual collections 16.8% below prior year, which amounts to $300,102 for an average practice. That is better than some may have feared, but still a significant drop to account for.
So, now that you have these two possible realities charted out, how can you leverage that information to help you plan your own recovery and right-size your P&L?
As stated above, both projections show a year-over-year income drop from lost starts and production during the closure and a tempered summer season. As businesses recover and reopen, most are taking a measured and phased approach to bringing back furloughed employees based on their expected volumes. To restate the point made earlier, if your peak starts in 2020 are 16-45% lower, you don’t have to turn everything on like a light switch. Consider making a complementary adjustment in how you staff and your choices around your operating expenses. Cain Watters and other respected financial consultants are advising their clients to take this opportunity to evaluate their teams, bucket expenses into ‘must-haves’ and ‘nice-to-haves’, and to take a deliberate approach to selectively turning these expenses back on as they reopen. Sound advice.
Not all practices will be on one curve or another. These curves represent a blend of practice performance. To quote a Chinese proverb, “When the winds of change blow, some people build walls and others build windmills.” Typically, during crisis economic times or events, strong performing companies with solid balance sheets will often jump to fill the vacuum and take share or seize the opportunity to acquire weaker competition. OrthoFi has been advocating that practices maximize the downtime to evaluate their approach and patient acquisition processes (e.g. streamline the new patient process to be effective for in-person or virtual consult environments) to emerge even more ready to play offense. Consumers will not beat down your door to come back.
Even before the outbreak, market data suggests that the average patient was seeing 2.5 orthodontists before deciding on treatment. For over 6 years, OrthoFi has been sharing data that as soon as a patient leaves your practice, you lose anywhere from 20 to 50 percent likelihood of getting that start (depending on whether they have a scheduled appointment to return). A more competitive environment with many offices now offering virtual consults will only exacerbate that, so you have to work harder than ever to connect with patients and convince them to choose you. And, it is more critical than ever, to invest in technology and processes that drive a same-day-start culture in your practice.
In regards to payment terms, our last article featured data that average payment terms (pay-infulls, down payments, and courtesies) have not changed very much during the crisis. However, as we’ve highlighted, you need to have an open choice concept in your fee presentation to balance starts and cash flow. Hopefully you have been following this direction, but it’s not too late. As you plan for your comeback, make sure you and your team are ready to hit the ground running with updated marketing programs, pending and recall management follow-up protocols, as well as referral nurturing. It might seem overwhelming, but with good tools and guidance it is well worth the time and effort.
Takeaways – What the Data Tells Us
- Collections are projected to be between 17-25% below prior year, with peak start volumes this summer anywhere from 16-45% below the original forecast. Take a measured approach to your staffing and operating expenses to plan for the lower end, then adjust up as you see the need.
- The variable that will likely determine whether we see a ‘Swoosh’ or a ‘V shaped’ recovery is consumer behavior, driven by concerns over financial affordability and safety. Make sure your marketing, messaging and outreach are focused on addressing those concerns.
- Not all families and consumers have been devastated financially, so the trick is to offer open-choice and ‘Intelligent Flexibility’. Data shows that most patients don’t need larger discounts or lower down payments, but be prepared for the ones that do.
- The market for treatment will most likely be more competitive coming out of this shutdown. Make sure you and your team are focused on playing offense. Invest time and resources into patient acquisition technology, marketing, pending management and referral nurturing. Spend less time on tasks that drain your focus and distract your team.
We hope this data and projections can be a valuable resource during this time. We will continue to update these metrics and add new areas of focus as meaningful trends emerge.
If you want to automatically receive these updates, please follow us on Facebook. If you have any questions you would like us to answer, please post your question on our page, or visit our website at StartMoreSmiles.com to connect with one of our practice experts.