In part two of this three-part series, we focused on how to increase average production per case by rationalizing in-network participation. As we detailed with data, many carrier networks add little quantifiable growth or conversion benefit to the practice and often require steeply discounted fees. Practices we worked with that were able to shed some of these networks saw meaningful increases in average and overall production.
For practices located in communities with dominant employer plans (e.g. Disney in Orlando or Wal-Mart in Bentonville) or have a high mix of patients whose plans only allow contracted providers to accept assignment of benefits, significantly reducing in-network participation may not be possible or advantageous. If you are one of those practices, fear not – there is a compelling solution for you that can have a similarly positive impact.
The landscape is also changing, with insurance carriers getting increasingly aggressive about coercing practices to participate in their networks. For example, many Delta Dental plans require providers to be in-network if they want to accept assignment (i.e. receive insurance payments on behalf of the patient) because they know doing so in today’s market is a must. Pushing the task of managing, following up, and collecting on a claim that will likely be paid in installments over the length of treatment is a significant disadvantage. In fact, OrthoFi’s data proves it hurts conversion rate – patients are 20% more likely to say ‘YES’ if any insurance coverage amount is deducted from the total fees displayed on the OrthoFi payment slider.
In addition to this strategy, some carriers take even more predatory measures to force your hand. We have seen carriers who received claims from out-of-network providers send communications to those patients to inform them that they could have saved money by selecting an in-network provider. Imagine that – they are marketing against you!
Yet another recently observed tactic has been to reduce the benefit amount for the patient if the patient chooses an out-of-network provider. For example, they pay a $2,000 benefit if the provider is in-network and only $1,000 if the provider is out-of-network. It’s important to understand your local carrier landscape to know which path to take on network participation.
If having some in-network participation is an inevitability for your practice, does that mean you are dead in the water? NO. With a clear and extensive understanding of the system and the individual carrier rules, you can navigate this treacherous channel and effectively offset the net discount to maximize average patient fees. Tina Byrne, a nationally recognized consultant and expert in this field, has partnered with OrthoFi to combine her carrier intelligence and her decades of real-life experience with OrthoFi’s vast database of claim payment outcomes and powerful machine-learning engines to develop a new solution called iMaxX™.
The iMaxX module creates a simple, repeatable, and sustainable workflow for your team to maximize every claim submission to expand the allowable fee. One of the main ways this is accomplished is to systematically prompt your team and guide them on, for each carrier plan, how to unbundle orthodontic treatment codes and itemize components of treatment. Many coordinators don’t realize that instead of submitting a claim for a single comprehensive treatment code (e.g. D8080), the practice can report additional procedure codes on their claim for diagnostic records like cone beam x-rays, intraoral photos, as well as scans. In some cases, these additional diagnostic codes may be covered by a carrier, which would increase the total benefits received. In other cases, they may not be covered but are allowed as an additional out-of-pocket charge to the patient to enable the practice to exceed the negotiated in-network fee. Unfortunately, these nuances vary widely across carriers and even within carrier group plans, so it is challenging for a practice team to factor for all these permutations and keep updated records of each individual carrier’s rules.
Another example of where iMaxX can be an invaluable tool is accurately recommending where or when a carrier will accept the D8999 code (most commonly linked to premium treatment appliances). Practices who treat patients with clear aligners, custom/CAD technologies, aesthetic appliances, etc. can often, depending on the carrier, increase their allowable fee by submitting a line item on their claim with procedure code D8999 and remarks reporting its usage. Again, not all carriers accept D8999, and not all accept it for the same things. That is where data and machine learning rules engines win the day. All these pieces fit together like a puzzle to deliver meaningful increases to your average case fee. How many dollars could this mean for you? Let’s consult the data.
Across the nearly 600 practices and over 1,200 locations in the OrthoFi database, we see that among the group of practices who participate in at least one carrier network, roughly 25% of their cases have an in-network discount applied. For those in-network claims, the average fee discount applied in 2023 was $1,033 per case. That means the average in-network practice is taking a blended discount of over $250 (~5%) per case across their annual starts. Since iMaxX has not yet been launched to all OrthoFi practices, there is a fair amount of variation in how effectively practices are managing their network discounts. Although OrthoFi’s team of insurance experts routinely consults with practices on these strategies, not all adopt these principles and many struggle with consistent application by their teams.
With all this variation in adoption, how can we determine the extent of what iMaxX can do? Drawing conclusions by looking at the average of the entire fleet can be misleading. To properly and scientifically quantify the real benefits, we prepared a cohort analysis to help isolate variables. We reviewed our practice base to identify the cohort of pilot practices we are working with who are most consistently implementing these practices and compared their results to a cohort we determined is deriving little to no benefit. Our methodology to identify these cohorts was to analyze claims submitted to identify single treatment code submissions vs multiple codes as well as the delta between a practice’s configured in-network contracted fees and the actual fees charged for those cases (excluding any other courtesy discounts).
Here’s what we found:
Cohort group definitions:
- Low/no implementation of iMaxX principles (shown as ‘Control’) – 55 locations, 22,818 total starts, $107.9MM total production
- High implementation of iMaxX principles (shown as ‘iMaxX’) – 55 locations, 21,396 total starts, $115.8MM total production
Results:
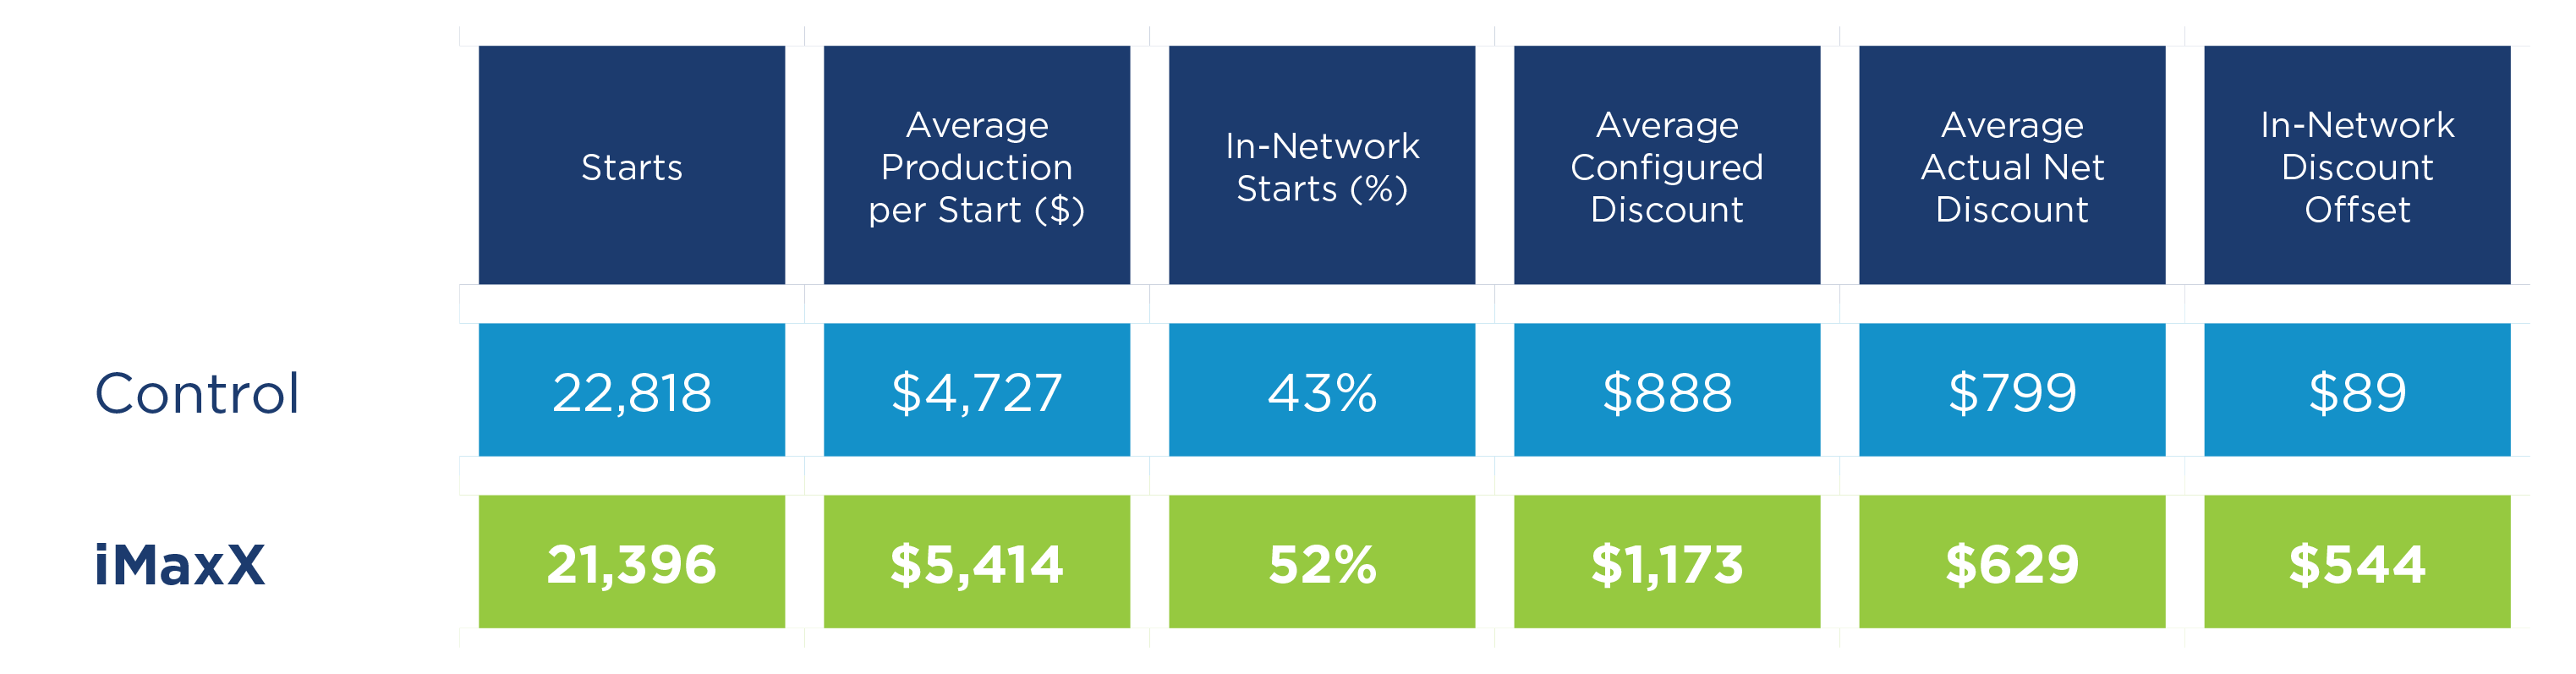
On an average of 43% of their cases, the Control group applied an average discount on in-network claims of $799 per case (compared to their average configured contracted discount of $888), which blends out to a $343 discount per case across their entire annual case volume. With only a $89 delta between contracted and actual net discount, this group absorbed virtually all their in-network discounts.
In comparison, the iMaxX cohort was able to leverage the recommended best-practice techniques to drive a significant return. In this group, although the in-network configured contracted fees would have averaged a higher $1,173 discount, the actual net discount applied was only $629, which means they were able to increase their fees on in-network cases by $544 per case for a total benefit of over $100K per location. Factoring in that 52% of their cases were in-network, that blends out to an incremental benefit for the iMaxX group of $233 per average case. For an average 300-annual-start practice, that means an increase in annual production of approximately $70,000. And remember – since the cost of treating these patients doesn’t change either way, 100% of this incremental production drops straight to the bottom line (i.e. pure EBITDA). That is the equivalent of starting over 10% more cases per year!
Conclusion
We are incredibly fortunate to work in a stable and relatively resilient orthodontic market. That said, after decades of consistent compounded annual growth of 3-4% a year, this might be the first time in recent history that we have seen a decline in starts multiple years in a row. In a period of perceived macroeconomic headwinds, exam volumes are likely to be flat or down (especially among adult patients).
As we have reviewed throughout this series, practices need to be savvier than ever to understand their pockets of opportunity to unlock ways to increase the value of each patient. A deeper understanding of insurance and how to navigate in-network participation is one of several ways. Investing in consulting partners and technology solutions like OrthoFi with iMaxX that arm you with subject matter expertise and scalable solutions can significantly impact revenue and profitability. Those who pursue those benefits now stand to reap even greater rewards when the market loosens up and starts resume their predictable climbing trajectory.
Interested in learning how OrthoFi can help your practice grow? Schedule a Demo Today.
Calculate your practice’s revenue potential with our iMaxX Calculator
How To Sustain Growth in a Tight Economy – Part 1: Increasing Net Fees