As we identified in part one of this series, the current economic landscape continues to trend light on consumer confidence with dropping savings rates and rising credit card debt. Gaidge data reveals that even though adolescent starts are beginning to come back, adult starts are down over 10% and have been dragging down the average practice by close to 4%. Many leading consultants expect a rebound sometime in 2024 once interest rates stabilize and start to abate. In the meantime, we can expect that adult demand for orthodontics will be soft, and since the birth rate has been declining for the last 15 years, the total addressable market of treatment-age kids is shrinking. This is not intended to be an apocalyptic epitaph. On the contrary, this is intended to empower you to take control of your P&L and discover ways to counter this cycle and sustain revenue growth.
In the first installment, we reviewed strategies to increase production by increasing treatment fees. That is simply one of the levers you can pull. The second lever involves a deep dive into your in-network insurance participation. If you are not in-network with any carriers, this will hopefully serve as reinforcement. If you are like an increasing number of practices, you are likely in-network with multiple payers. Insurance companies effectively market the benefits of their networks, promising a steady stream of new patients who will find your practice from their provider lists. How do we know if that is real or a play on your FOMO? OrthoFi’s data on over 1 million patient starts and over half a million submitted claims can shed light on this question.
At the end of 2022, OrthoFi completed an analysis to validate the impact of in-network on practices’ starts. To do that, we isolated two cohort groups within our customer base that were active for the full year: one that was not in-network with any payers (28% of practices), and one that was in-network with two or more payers (30% of practices). We decided to look at multiple in-network practices to ensure that there would be enough in-network patient volume to be statistically significant. In each cohort, we measured their Treatment Recommended Conversion rate (TRC – Learn more here) and their Kept New Patient Exam (Kept NPE) rate. We also looked at the average fees of each group to measure the impact of in-network discounts. If, in fact, being in-network is a source of incremental case volume, you’d expect one or both of these metrics to reveal that, and you would expect the delta in starts should more than offset the concession on fees. However, that is not what we found. Here are the results:
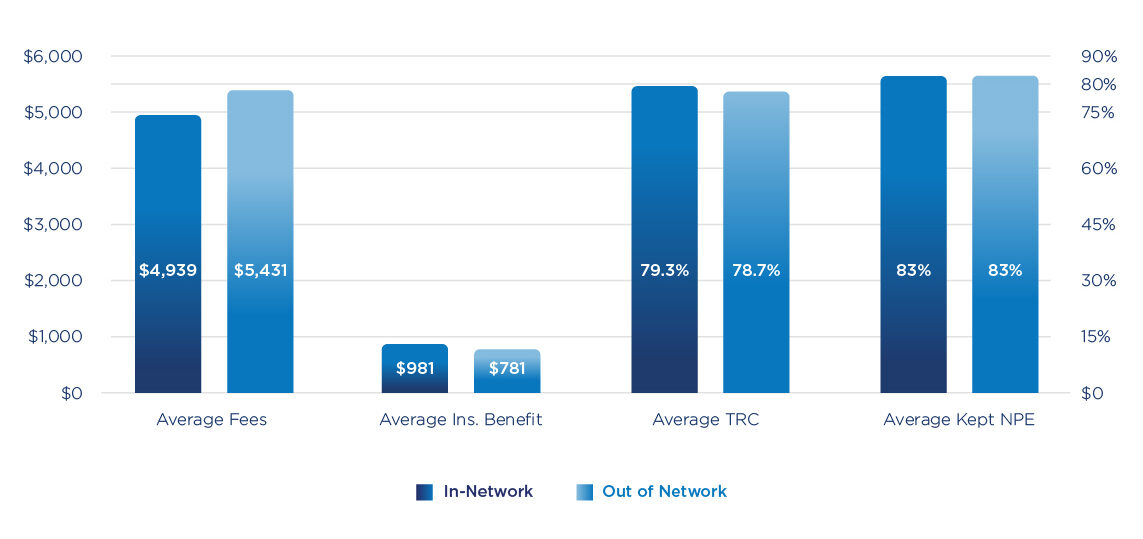
The table shows that although the in-network practices were able to offer higher benefits to their patients (i.e. lower out-of-pocket expense), they saw the same rate of kept exams, and they saw virtually the same conversion rate. The only separating factor between the cohorts in terms of revenue to the practice is the average fees. Because the in-network practices were contractually obligated to offer discounted fees, their average fees were lower by $402 per case across all their cases (which means their fees with in-network insurance were more than $800 lower). So the average-sized practice in-network with multiple payers is giving away $160,000 in additional discounts, and seemingly not reaping the reward of more patients promised by the carrier networks.
Now there are a couple of things to clarify in that statement:
1) I do not want to imply that practices should not accept assignment of benefits. Telling today’s patient that they need to commit to the full fee out of pocket and follow up with their carrier to make sure they get paid is a significant competitive disadvantage. In fact, we have consistently documented that patients without insurance coverage to reduce their out-of-pocket portion convert at 18 to 20 percent lower rate than patients with eligible insurance. So for most carriers, you can look to be out of network but still be credentialed and accept assignment of benefits.
2) What this data lacks is if/how in-network participation affects inbound call volume by patients who might find their orthodontist via carrier websites or directories. Given that the average starts for each cohort group were similar, we believe the impact of traffic is insignificant, and certainly does not come close to offsetting the $160,000 delta in annual production.
3) There are certainly select payers and plans that demand in-network participation. For example, Delta Dental only allows assignment of benefits to its in-network providers. Although we question the fairness of this practice, it is a fact of life. Similarly, there are certainly some dominant local employers with great coverage plans (e.g. Wal-Mart’s plan in Arkansas and Disney’s plan in Orlando) where it is smart to participate in those networks. But as Kenny Rogers sang, “you gotta know when to hold’em, [and] know when to fold’em”.
After over 10 years of managing insurance receivables, OrthoFi has built up a solid library of data on carriers, plans, average in-network fees, etc. We are able to partner with practices to help guide them to maximizing their fees by curating their in-network participation. One such practice came to us with a particular ask: the doctor intended to cut his working days from 5 days to 4 days, so he knew that would cut into his starts per year. However, he wanted us to help him offset this hit by increasing his average fees. In addition to looking at his fee schedule, we took a hard look at the insurance discounts offered. The results were incredible.
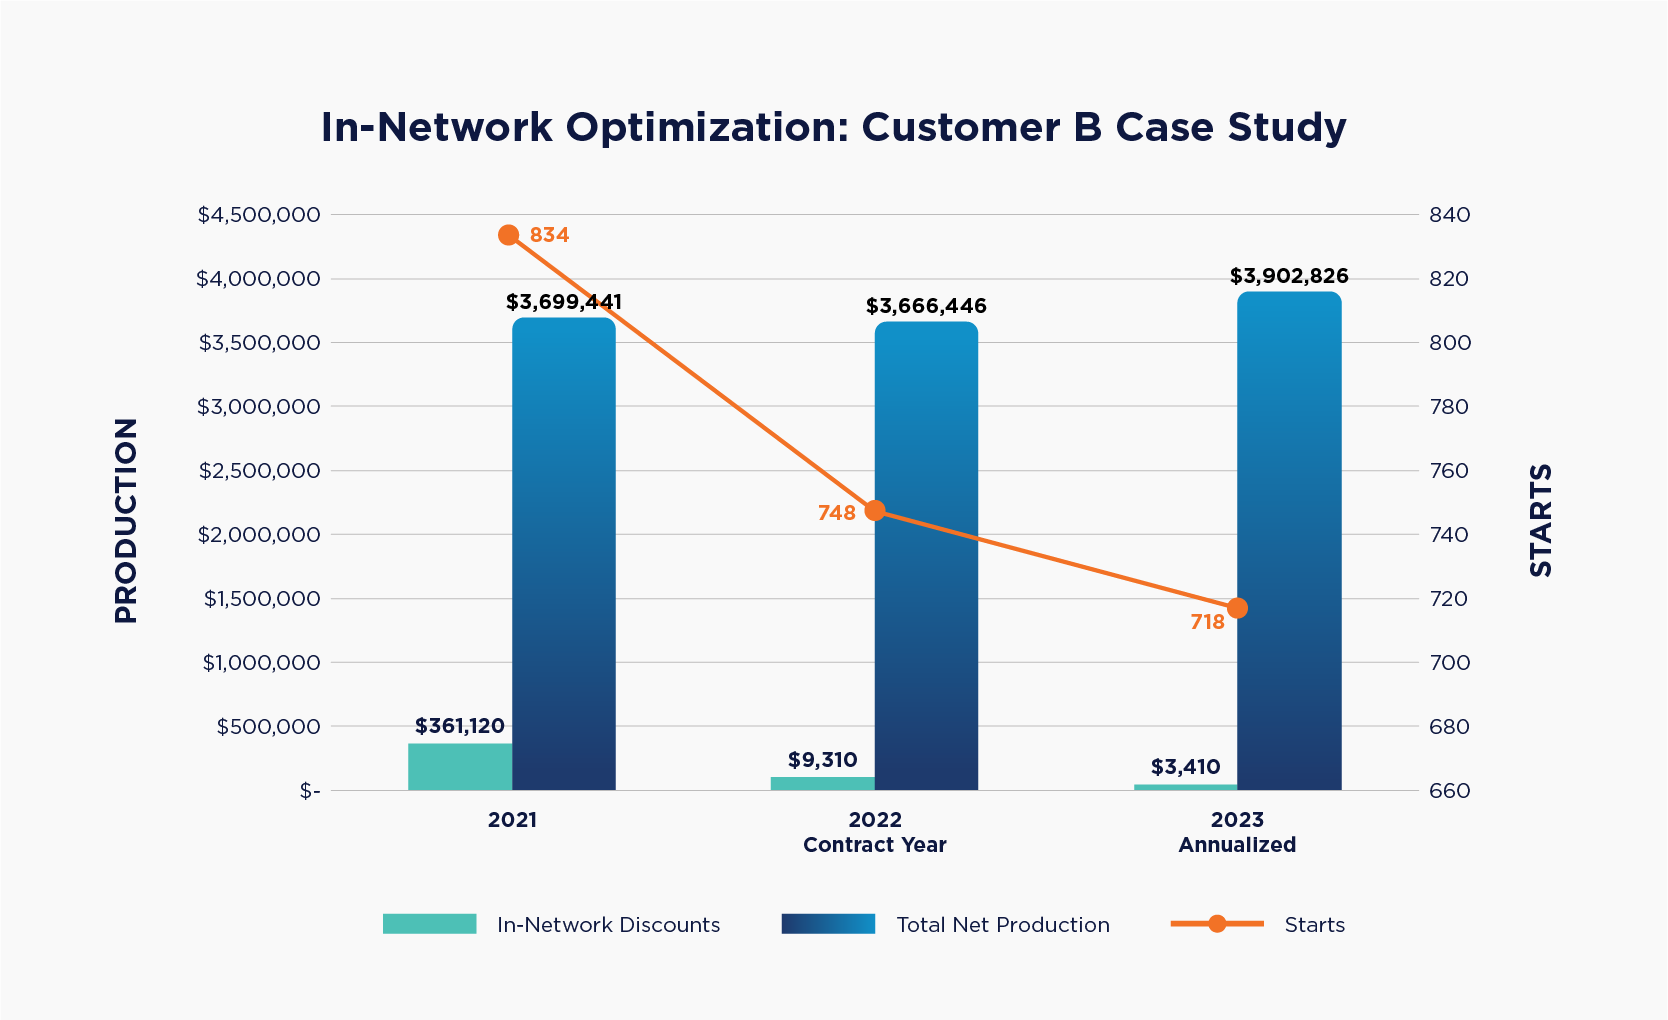
Despite his starts declining 14% over a two-year period (10% in the first year alone), by rationalizing his network participation was able to slash his insurance discounts from over $361,000 to just over $3,400. That contributed to his average fees increasing nearly $1,000 ($4,436 to $5,435), which virtually offset the impact of fewer days completely. In 2023, his practice is tracking to actually increase production despite tracking to do even fewer starts. All that net increase in fees also drops straight through to the practice’s bottom line. As with any strategy to increase net fees, especially when it involves increasing the out-of-pocket expense for patients, it is crucial for the practice to adopt the principles of Intelligent Flexibility. Allowing patients to extend terms when needed preserves the affordability of treatment, and ensures the practice can stay competitive in their market. This outcome is a testament to the power of data and the importance of partnering with experts to drive winning results. Perhaps the most satisfying aspect of this case study is that the thrust behind the project was to give a customer better work-life balance, to allow him more time to enjoy his life and his family. Win-win is often an overused term, but I can’t think of a better example than this.
Conclusion
So as you can see, there are many ways to offset the revenue impact of declining starts. In this particular case, the drop in case volume was planned. For many practices out there, the economy is dictating the terms and dulling consumer demand for treatment. With the right information and the right partners, there is always a path. For some reading this, getting out of network might seem too risky or extreme. In that case, you need to read the next installment of this series, where we’ll take another cut at insurance and cover how to maximize in-network reimbursements to minimize the sting of discounted fees. Tune in.
Interested in learning how OrthoFi can help your practice grow? Schedule a Demo Today.
How To Sustain Growth in a Tight Economy – Part 1: Increasing Net Fees